Welcome to CSML


Welcome to CSML
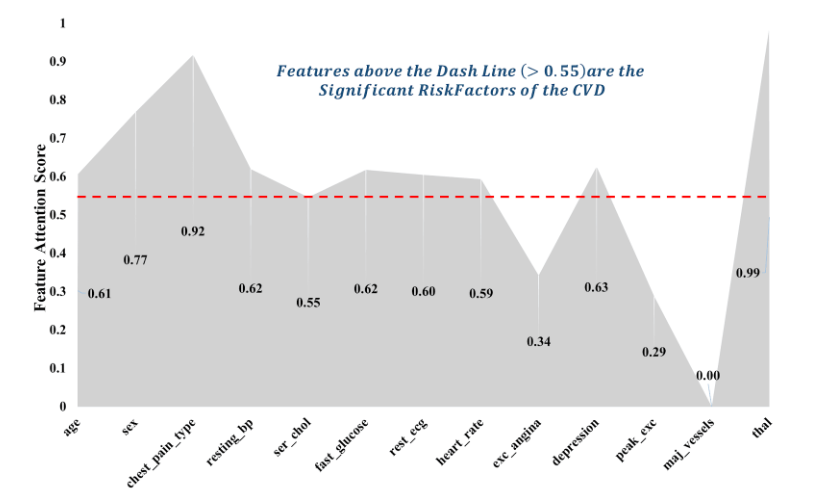
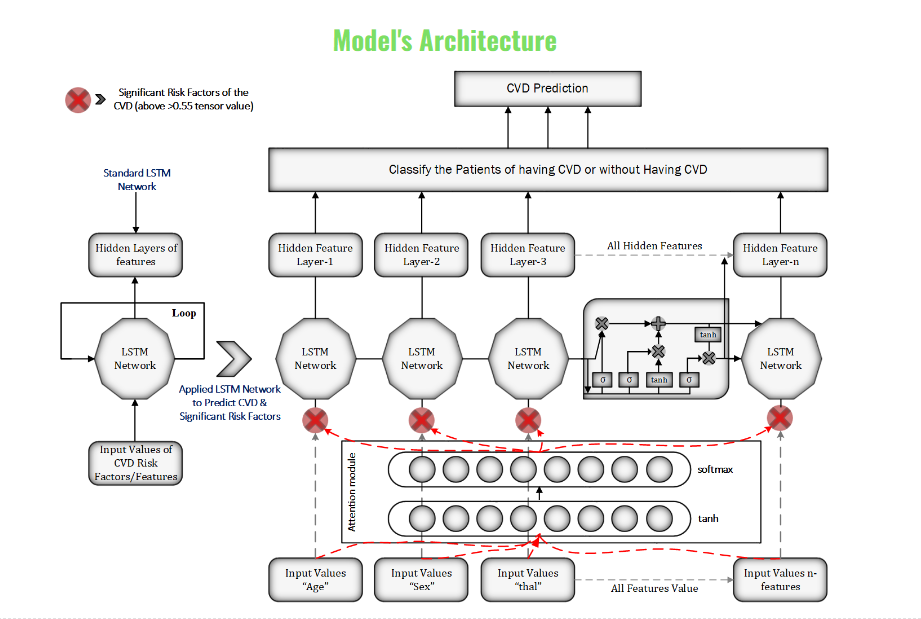
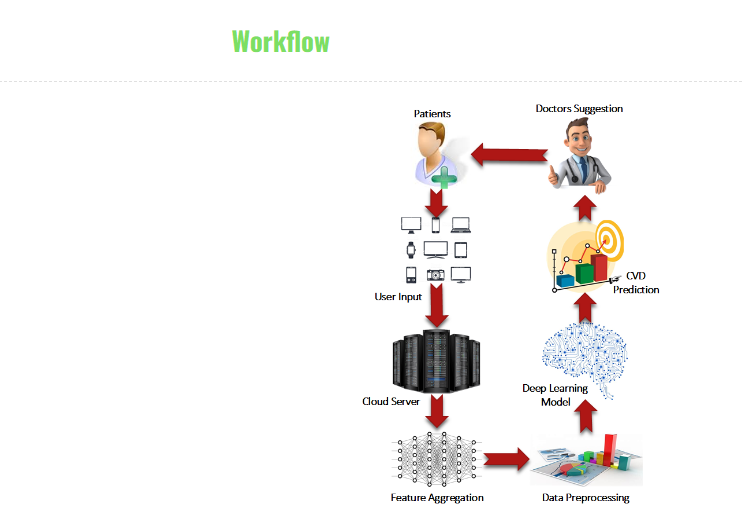
Cardio-Vascular Disease (CVD) is one of the leading causes of death all over the world with expecting approximately 23.6 million individuals to be attacked by the CVD by 2030. Thus, the healthcare industry is trying to gather a large amount of CVD information, which can help the doctors to detect and identify the potential risk factors of the CVD. Deep learning can dig out the hidden pattern of the disease and symptoms from this structured and unstructured medical information. As a result, in this paper, we propose an algorithm to predict the risk factors of the CVD using the attention module based Long Short- Term Memory (LSTM), which has almost 95% accuracy and 0.90 Matthews Correlation Coefficient (MCC) scores; better than any other previously proposed methods. Moreover, we propose a novel Intelligent Healthcare Platform for continuous data collection and patient monitoring system. Initially, the proposed platform is used for data collection, and we find out the best suitable features from the dataset for applying various machine learning algorithms. The experimental results show that the attention module based LSTM outperforms than the other statistical machine learning algorithms for the prediction as well as indicates significant risk factors of the CVD, which can be supportive for the CVD patients to change their lifestyle.
The KITTI Visual Benchmark Suite is a dataset that has been developed specifically for the purpose of benchmarking optical flow, odometry data, object detection, and road/lane detection. The dataset can be downloaded from here. The road dataset has a dimension of 375 by 1242 pixels and contains 600 individual frames. It is the primary benchmark dataset for road and lane segmentation. This benchmark was developed in partnership with Jannik Fritsch and Tobias Kuehnl of Honda Research Institute Europe GmbH. The road and lane estimate benchmark includes 290 test and 289 training images; including three distinct types of road scenes, which are given below. Figure shows some example data (UU, UM, and UMM) plotted by MatPlotLib in RGB format.
UU: Urban Unmarked
UM: Urban Marked
UMM: Urban Multiple Marked Lanes